
The Best Garbage Collection for JMeter: Automated memory management is one of the core features of Java. By default, JMeter uses the G1GC algorithm to clean up the unreferenced objects in the heap. GC algorithms have been evolving for the past many years. In this blog article, I have done some experiments using the various GCs in JMeter to identify which GC algorithm yields us more threads to run in a bare metal medium powered laptop.
Before getting started, I am sure that some of you may not agree with the environment setup to validate the GC, base lining the maximum number of threads using the load model etc. If you are not satisfied with this setup, please share your comments so that I can learn along with you.
I am not going to bore you with the formula to come up with the maximum number of threads that we can inject. Instead, let us focus on the experiment.
Table of Contents
Back to basics
What is Garbage Collection?
In Java, everything is an object. Object needs a place to live and it will be huge. When you start the Java application, your Java Virtual Machine creates new objects in the Young Generation which is expected to be short- lived. But sometimes, objects will live longer and takes up the heap space.
The longer the object lives, it is likely to become garbage collected in the Old Generation. Watch the phrase, it is likely. JVM may clean up the unreferenced object or it may not. It is up to JVM’s decision.
So, what is an unreferenced object? If the object has a reference in the stack memory, then it will not be garbage collected. Else, it might be garbage collected.
Above example is from the G1GC perspective, at least at a high level. If you want to learn more, please check my Performance Engineers playlist on YouTube.
Types of Garbage Collectors
Without deep diving into the GC algorithms, let us see the high-level overview about the following types of Garbage Collectors in Java.
- Serial Garbage Collector
- Parallel Garbage Collector
- CMS Garbage Collector
- G1 Garbage Collector
- Epsilon Garbage Collector
- Z Garbage Collector
- Shenandoah Garbage Collector
In this experiment, I did multiples execution using commonly used GC algorithms namely: G1GC, Z GC, and Shenandoah GC.
Serial GC is one of the simplest GC algorithms. It uses single thread to carry out the GC activity. It is not ideal for multi-threaded application like JMeter.
Parallel GC uses multiple threads to carry out the GC activity, but it injects the pauses while doing the GC.
CMS (Concurrent Mark Sweep) GC is deprecated algorithm in Java where it marks the referenced object and sweeps the remaining. It needs more CPU to achieve more throughput. Since it is deprecated, I have not included this GC for the experiment.
Epsilon GC is a passive GC. Meaning, it will not perform any GC. Once the heap is full. It just terminates the application. It is useful to baseline the configuration and for testing your application. Hence, I am not using Epsilon GC in this experiment.

For more memes, please check this repo.
G1GC (Garbage First Garbage Collector) is one of the commonly used GC algorithms in Java and it is the default GC in Java 11. It separated heaps into multiple regions as I mentioned above and carry out the GC activity efficiently. G1GC is performant than CMS GC.
ZGC yields less than 10ms GC time. It performs all the expensive work concurrently. ZGC yielded surprising results in this experiment. It works well with the large volume of heaps.
Shenandoah GC is from Red Hat team which the low pause time garbage collector that reduces GC pause times by performing more garbage collection work concurrently with the running Java application. Whether your heap size is 200 GB or 2 GB, the semantics is identical.
Experiment Setup
I have not used Docker setup to run these tests. I want to measure the performance of each GC for JMeter in a bare metal machine. My laptop is at least six years old. But it is running, great apart from fan speed.
Below is the system configuration:
- OS Name: Microsoft Windows 10 Pro
- System Model: Inspiron 15-7579
- System Type: x64-based PC
- Processor: Intel(R) Core (TM) i7-7500U CPU @ 2.70GHz, 2901 Mhz, 2 Core(s), 4 Logical Processor(s)
- Installed Physical Memory (RAM): 16.0 GB
Java and JMeter versions are as follows:
- Java version for G1GC and Shenandoah is Java 11.
- AdoptOpenJDK with Hotspot JVM
- Java version for ZGC is Java 16.
- AdoptOpenJDK with Hotspot JVM
- JMeter 5.4.1
- No JMeter plugins
- Max heap size allocated is 4 GB for all the experiments.
Demo application set up:
- Jetty 9.4.38.v20210224 hitting sample demo application at localhost:8080.
JMeter Test Plan
- Total number of HTTP Samplers: 8
- Constant Timer of 300 milliseconds
- Total Bytes for all the requests: 894.388 Kilobyte
Before I started the experiments, I have closed all the resource consuming programs such as Vivaldi browser, MS Outlook, One Drive, Docker, MS Office programs, recording software, and more.
I have kept only the following programs open:
- Two terminal sessions – to run Jetty application and JMeter in CLI mode.
- Notepad – to take notes.
- Snagit – to capture the screenshots.
- Task Manager – to view the CPU and Memory trends.
Of course, there will be background processes running e.g., Anti-virus, daemon apps etc. I cannot kill those.
Following are the assumptions we can make:
- 50% of RAM i.e., 8 GB is for Operating System
- 4 GB is allocated to JMeter which is consistent across the multiple runs.
- 1 GB might be allocated for the daemon threads.
- We are making use of 3 GB of RAM slice.
- Remaining might be consumed by Jetty app.
- No network overhead as we are using locally hosted app.
From JMeter perspective, there is no resource consuming elements in the test plan.
Also, after each run, I gave some breath time for my system, so that it can come back to normal utilization.
How to change the heap size in JMeter?
Open jmeter.bat in your favorite editor and edit the line which has SET HEAP and configure the heap size to 4g e.g. set HEAP=-Xms4g -Xmx4g -XX:MaxMetaspaceSize=256m
The Best Garbage Collection for JMeter Experiment
G1GC
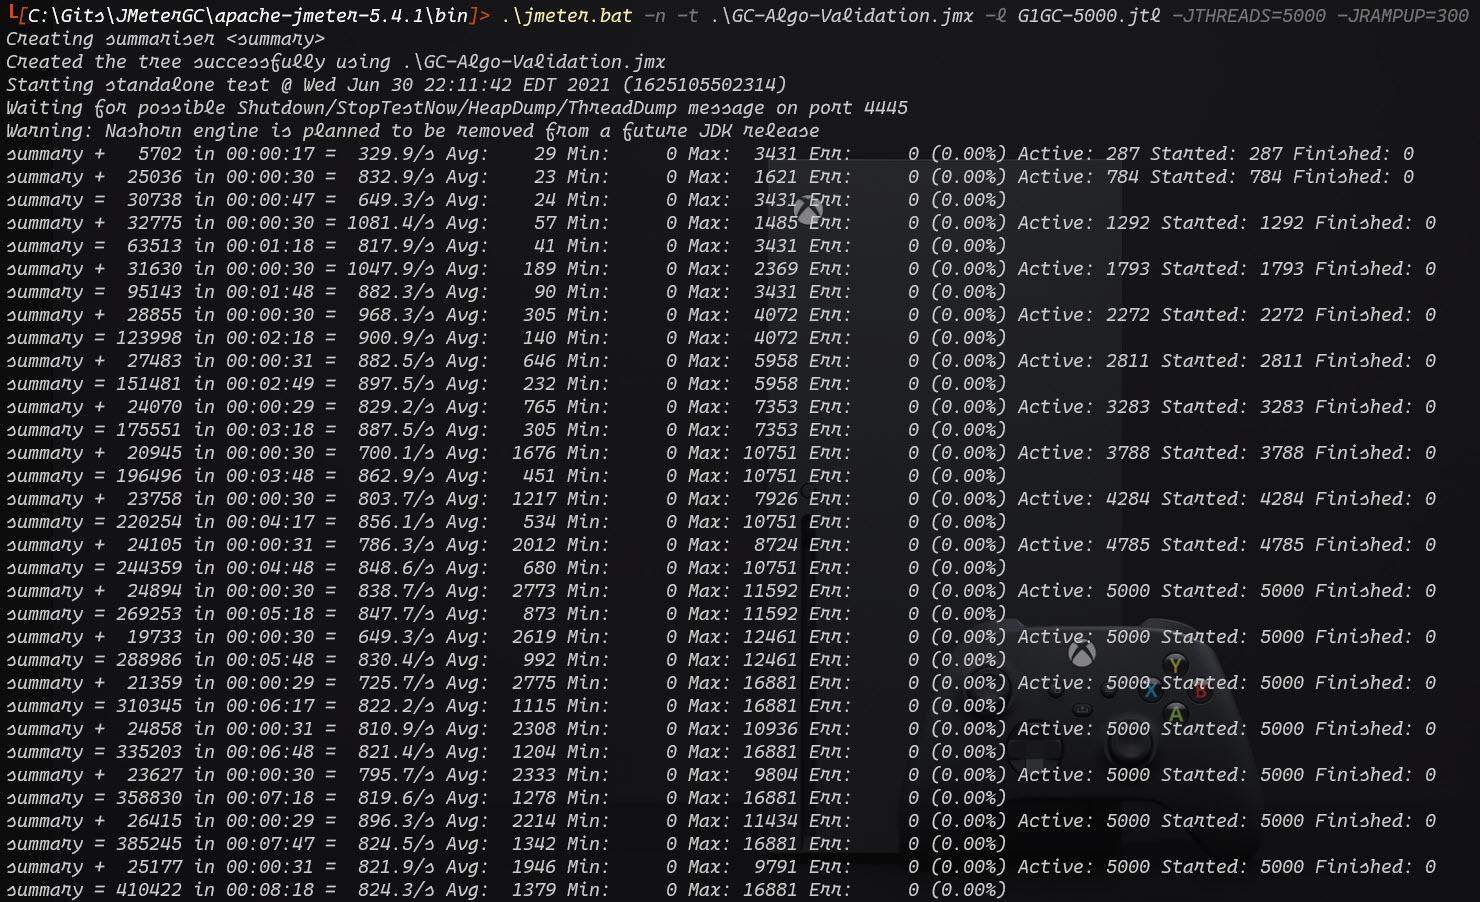
I started my experiment with G1GC as it is the default GC in Java 11 and with 5000 threads with a ramp up of 300 seconds. I am aware that this number is high considering my system configuration. But surprisingly it performed well.
Throughout this experiment I am focusing only on the number of threads that JMeter can inject. Jetty will throw high response time eventually. The response time, number of failed transactions, and other parameters are secondary for this experiment. But in your actual project, you need to consider all the parameters.
Below is the 5000 threads – G1GC screenshot. It is a clean run. For every run, I terminated the execution after few minutes of ramp up.
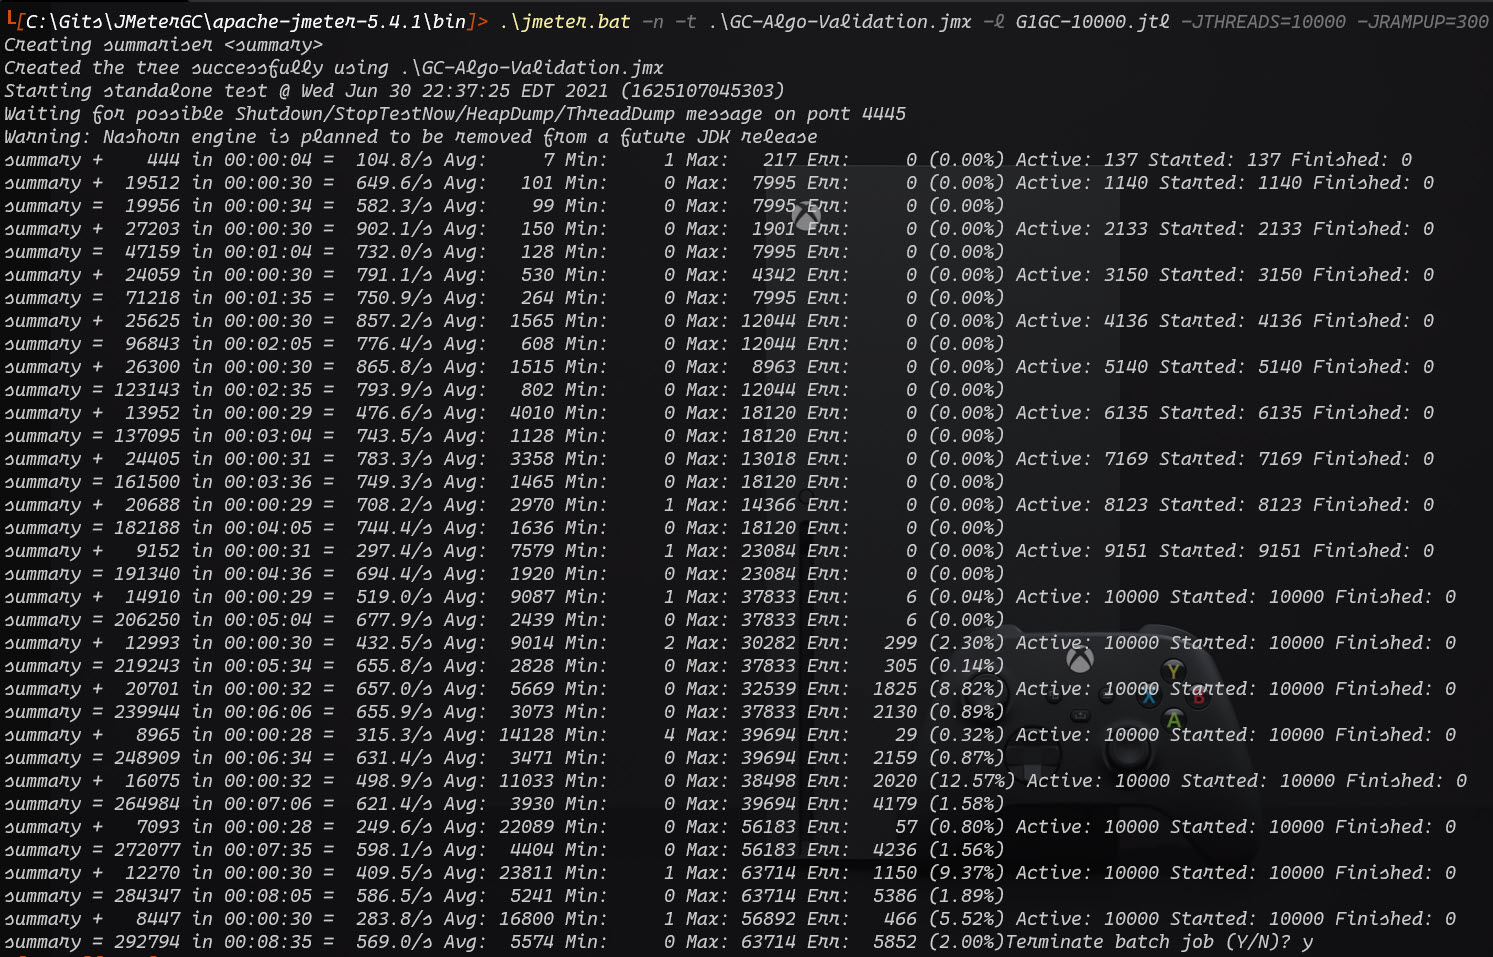
Next run I injected 7000 threads which is also performed well. But it 10000 threads run, I started seeing failures as shown below.
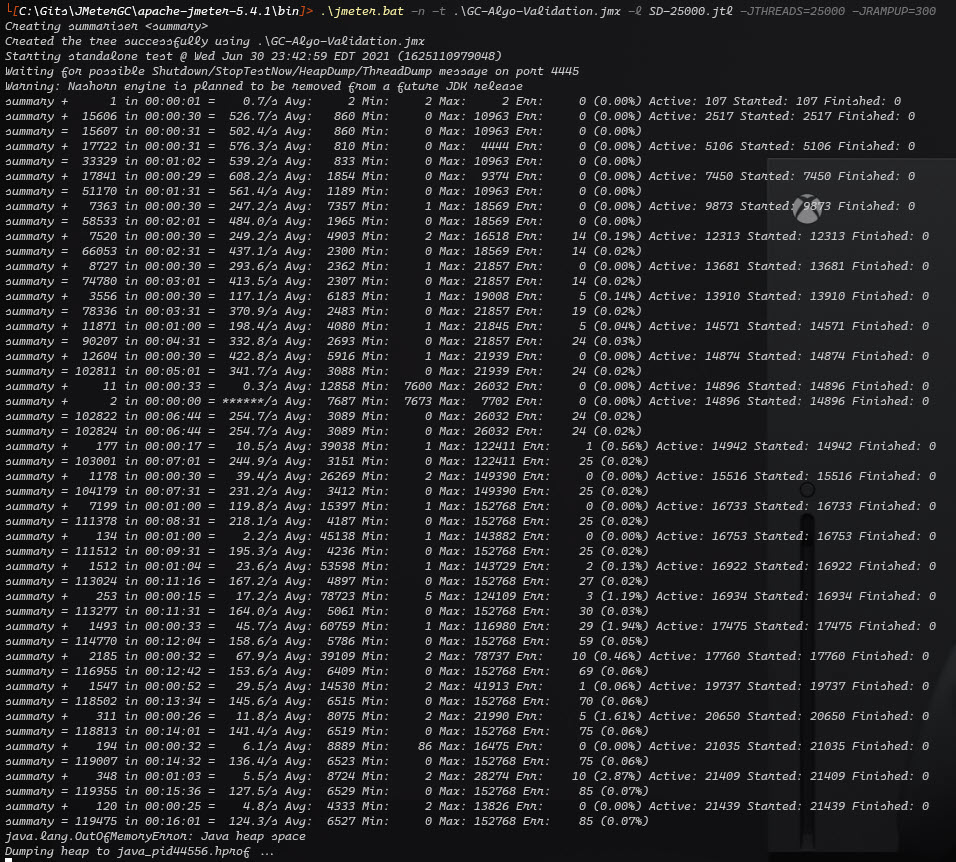
In 12000 and 15000 threads run as well, the trend persisted. After these runs, I injected 25000 because of over confidence. But surprisingly, 20809th thread JMeter threw Out of Memory (heap space) error. To know more about this error, please check my YouTube tutorial.
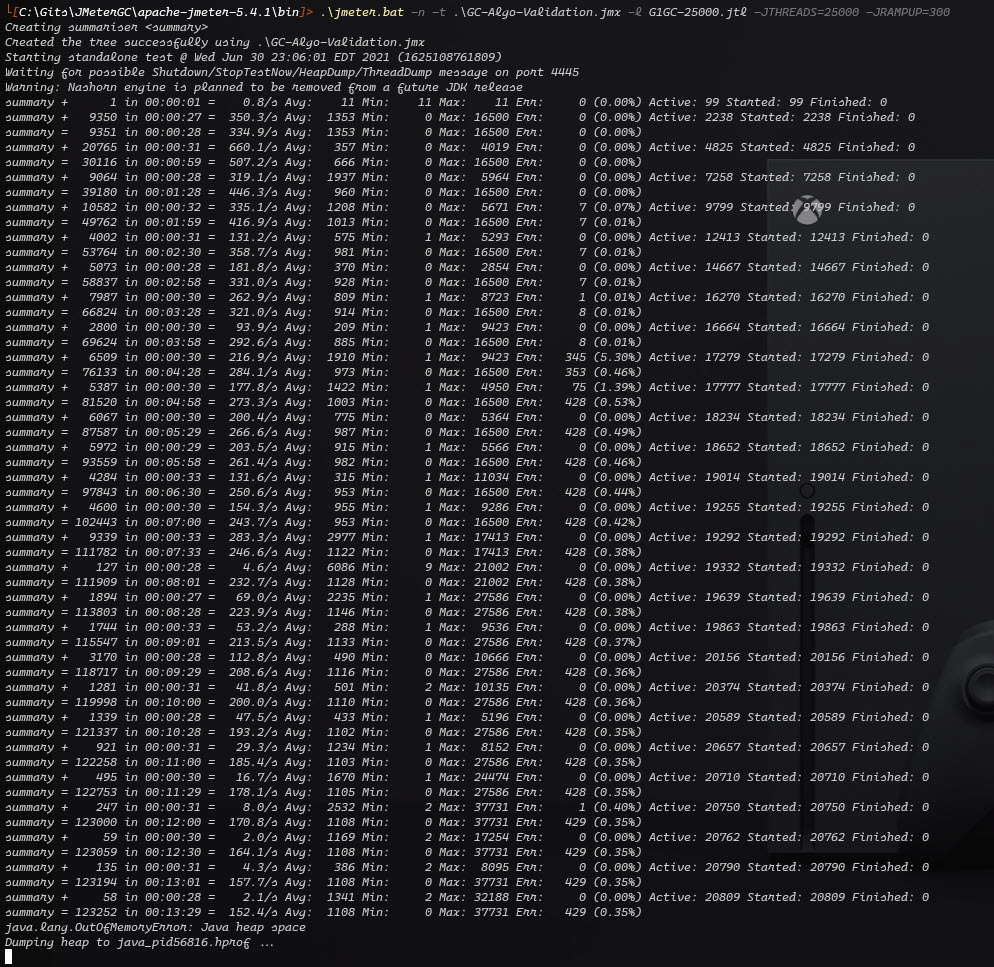
I repeated the same run, the outcome is similar.
Let us conclude G1GC experiment stating that JMeter could inject around 20000 threads in my system configuration.
Shenandoah GC
To change the GC algo in JMeter, open jmeter.bat and add the below in ` set GC_ALGO` line:
-XX:+UseShenandoahGC
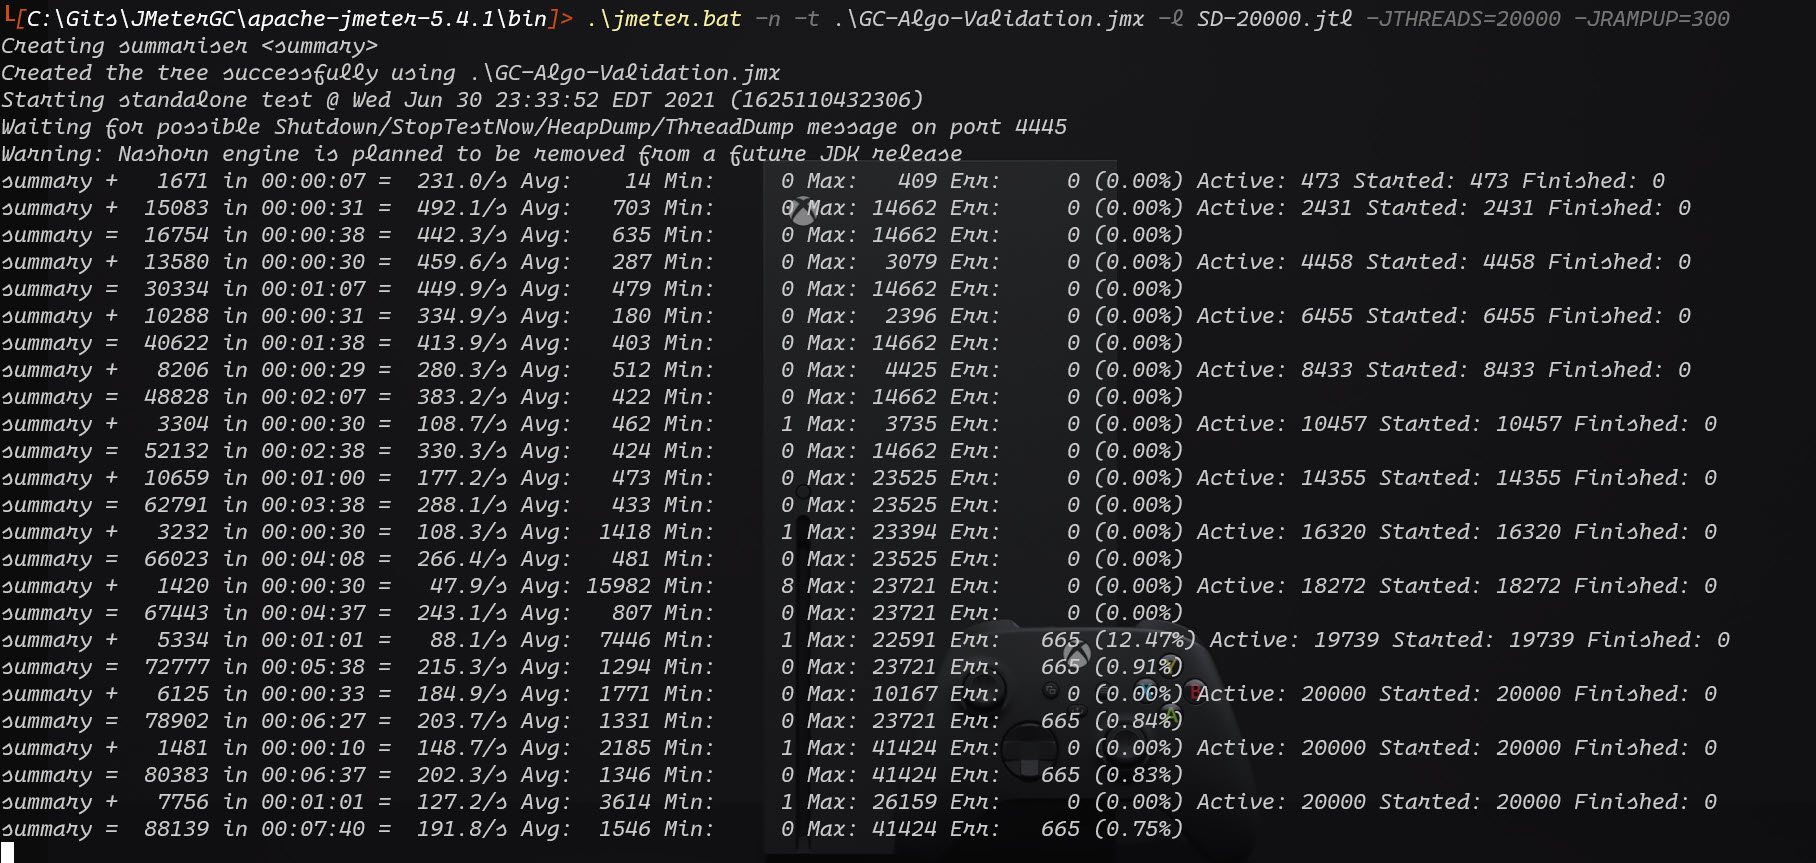
As we know, Shenandoah GC should perform better than G1GC. Let us see the Shenandoah GC results. I started my first test with the over confidence by injecting 20000 threads. Shenandoah GC handled well. Here is the screenshot.
Then, I increased the thread count to 25000. It broke at 21439th thread with heap space out of memory error. If you see the error count, it is surprisingly less.
ZGC
To change the GC algo to ZGC, open jmeter.bat and add the below in `set GC_ALGO` line:
-XX:+UseZGC
Here comes the next surprise, I started ZGC with 25000 threads. My bad. See it for yourself. It threw heap space out of memory after 8000 threads. I am not sure why. If you are expert in ZGC, please share your inputs in the comment section.

Even for 10000 threads, I got out of memory error again.
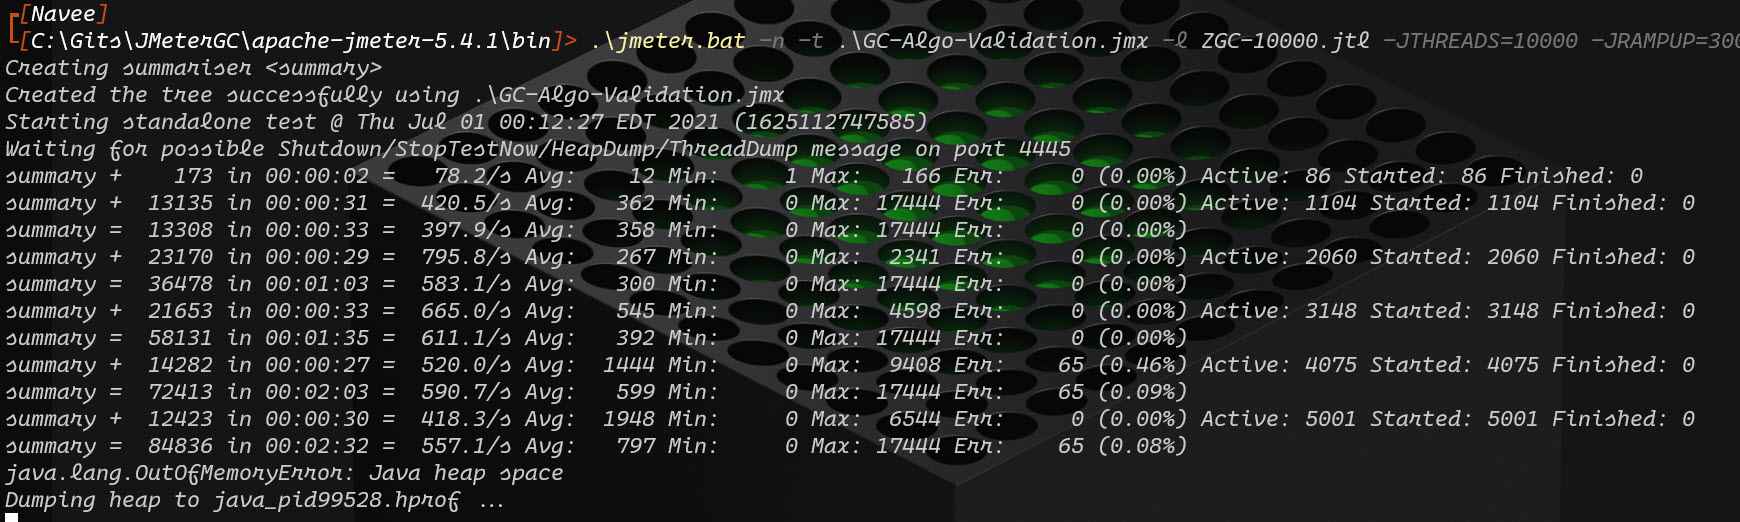
But it ran well for 5000 threads. As the ZGC, threw OOM for 10000 threads, I did not purse my experiment further.
Observations
G1GC injected more than 20000 threads without any issue. But there were some stutters during the execution, I am not sure is it because of my OS or JMeter. I should have executed with Visual VM, but I do not want to have overhead again. G1GC had lot of errors in the samplers consistently across high volume runs.
Shenandoah GC handled the load well. The number of errors were less, observe the trend in the above screenshots, you can easily correlate. Response times were high. From my perspective, I never bothered about that. My focus is only on active threads.
I expected much from ZGC, but it ran out of memory too soon. Maybe it needs more slices to work with. But clearly ZGC is not apt to run high volumes test.
If you can carry out this experiment in a high-powered instance in cloud, you can begin with ZGC by slicing more memory into it.
I can hear you saying that, why you have not tuned the GC parameters to yield performance. My intention is to try just vanilla flavors without touching the other parameters. The main reason is there are too many parameters to begin with. E.g. Shenandoa GC has three modes: normal/satb, iu, and passive. Default is normal/satb. Tuning these parameters might have yielded more number of threads. If you take G1GC, we could have achieved more performance. I am not a tuning expert. Let me conclude the experiment here.
Conclusion
From multiple runs with varying number of threads, G1GC and Shenandoah performs almost similar in terms of performance. Further tuning of G1GC might have outperformed Shenandoah GC and vice-versa.
ZGC algo has failed in my system configuration. But it could perform better in a better environment. To choose the best GC, you need to run your tests with each GC and baseline each number in your environment setup. You will get surprising results as me.
Why we are trying to find best Garbage Collection for JMeter instead of best Garbage Collection for Application (under load)?
I have already stated my objective clearly :). I am trying to find the maximum number of threads that can be spawned for each GC Algo.