
In this blog article, we are going to see how to analyze top command like a pro. I am learning Linux extensively from past couple of years which is helping me to learn more several Linux based tools. One of the frequent command is top among system administratots and engineers.
Table of Contents
What is top command?
top command displays the Linux processes on the host. Here is the definition from the manual:
The top program provides a dynamic real-time view of a running system. It can display system summary information as well as a list of processes
or threads currently being managed by the Linux kernel. The types of system summary information shown and the types, order and size of information displayed for processes are all user configurable and that configuration can be made persistent across restarts.
Engineers use top mostly to view the list of processes, its CPU and memory usage and other details.
Here is the screenshot of my Raspberry Pi processes:
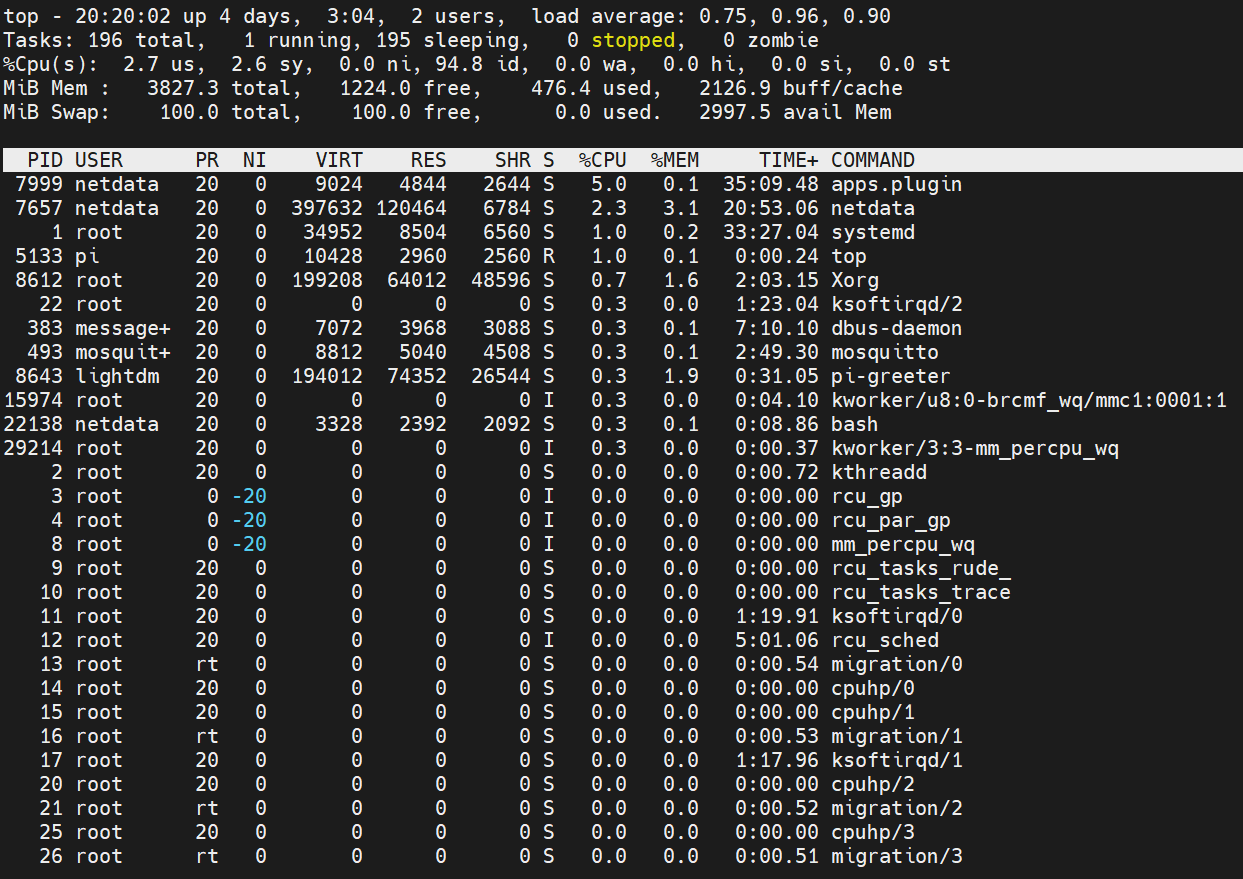
It displays the processes in a table format with several columns as shown above.
You can type h to view the shortcuts which will help you to navigate. E.g. if you type m which will display the memory info at the top.
How to analyze top command like a pro?
If you are getting started with Linux and would like to analyze the top command, going thru in the table view might be overwhelming.
I will share you the cool tool from yCrash which will help you to deep-dive into your top metrics.
Copy your top command output to the clipboard and launch https://ycrash.io/yc-top-analyzer.jsp
Paste the top command output and then click on Analyze button as shown below.
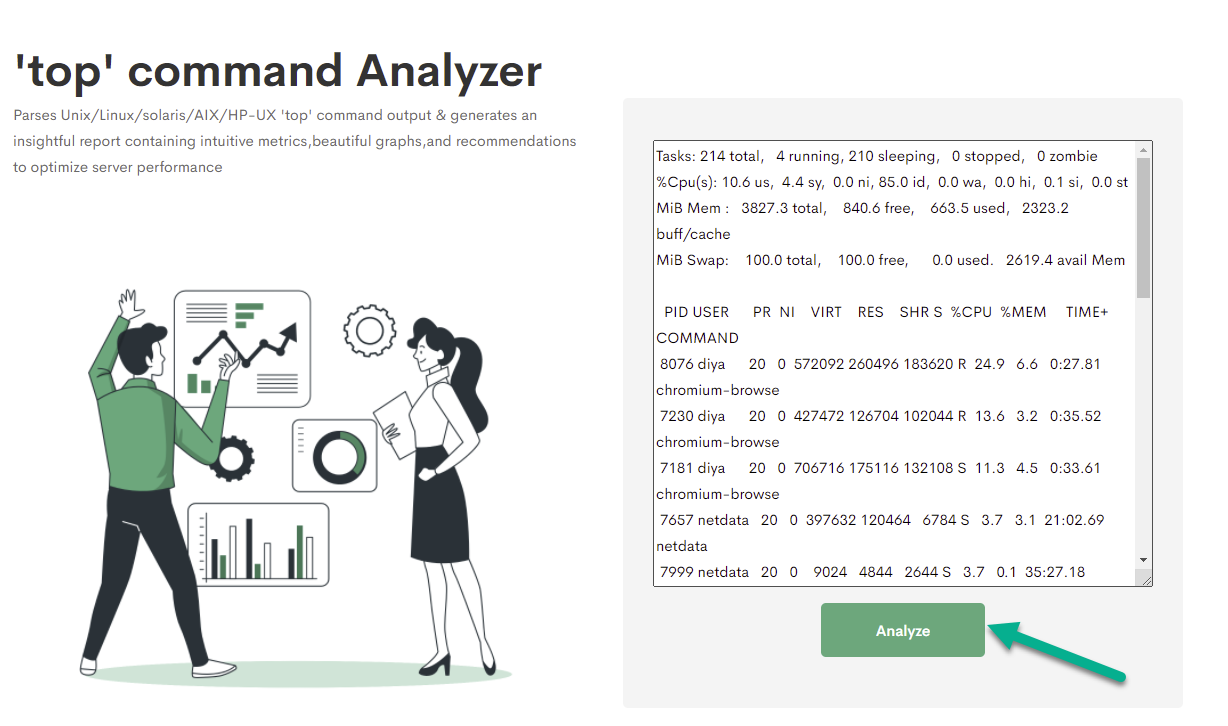
Once you click on Analyze, top command Analyzer will give you a unique URL like this https://ycrash.io/yc-report-top-public.jsp?ou=yc-public&de=1.1.1.1&ts=2021-06-26T20-28-2&app=top-app
The tool will analyze the metrics and present it a neat format. In my case, I have got two issues: Free memory is less than 5% of total memory and Used swap memory is more than 10% of total memory.
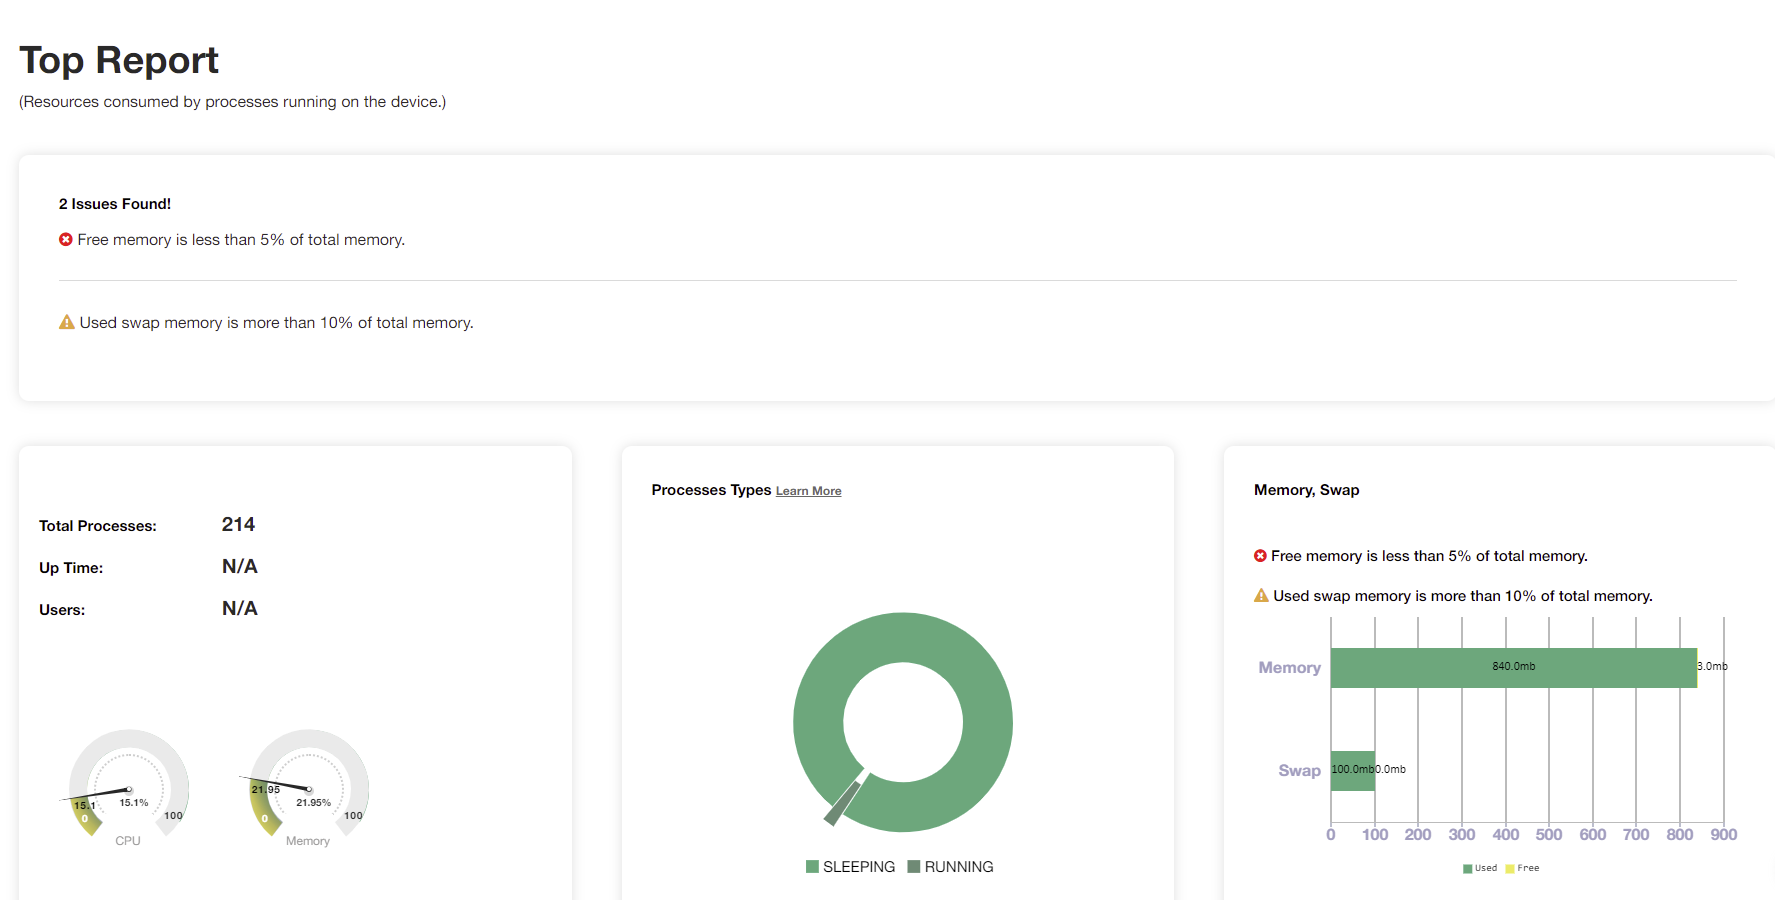
The top report will display the pie chart, bar chart, and a tabular view of the processes. There are relevant help links for each panel which will help you to learn further.
As you see, analyzing the top command output is quick and easy using this cool tool. Please give it a try and let me know if you have any questions.
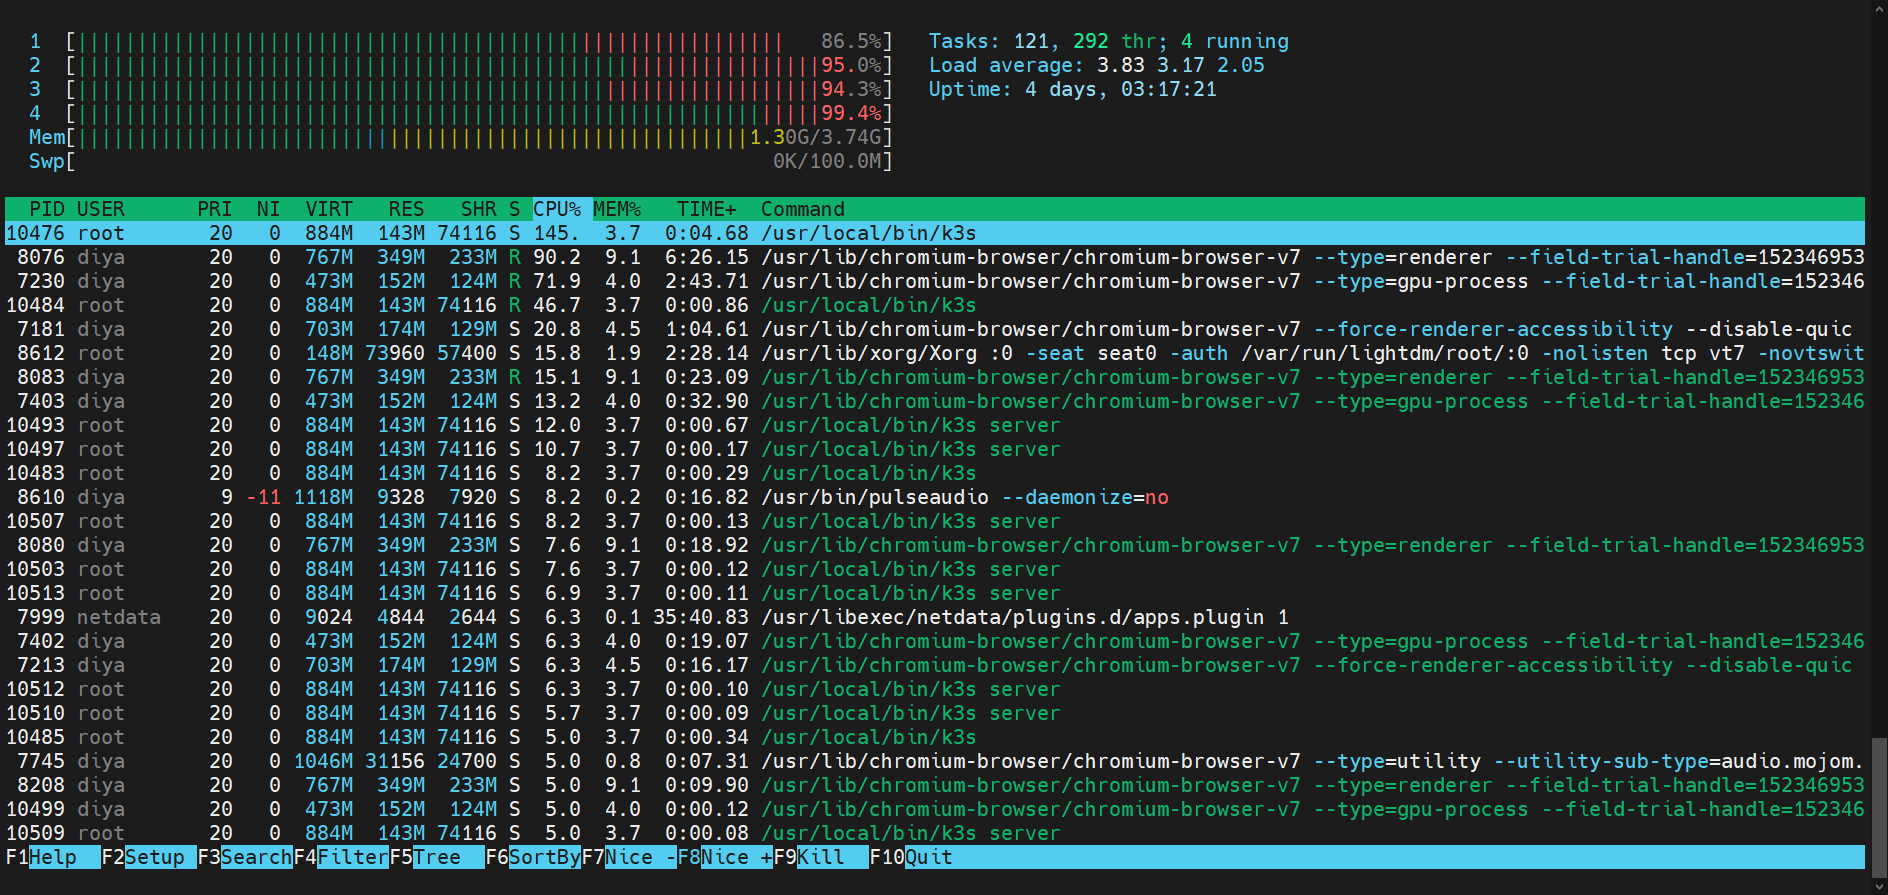
Here is a tip, if you want something fancy you can install htop tool.
I’m a beginner in linux fundamentals. This idea makes me visualise and comprehend better. Thanks for making life easy Naveen.
Glad it helped :)
Thanks for sharing the info.
Like you mentioned that free memory below 5% is one issue. But that is incorrect, you should refer available memory for that mater.
Free memory is calculated based on inactive memory whereas available memory will list inactive memory and active memory which is available to be allocated for other processes.
Hi Shubham, I see where you are going :) In my case below is the estimation, correct?
Used Memory = Total 3827.3 – Free 1224.0 – buff/cache 2126.9 = 476.4
Available Memory = 3827.3 – 476.4 = 3350.9
Please confirm. Thanks!
Hello Naveen!
Looks like top command what you have in your decription is different from what you have entered in to the https://ycrash.io/yc-top-analyzer.jsp
No sir, I calculated from the screenshot in this blog post. Which metric is incorrect, please :)