
I have been doing performance testing during the US holiday season for the past three years. For the first two years, it was manual testing by bringing up the developer tools and by counting myself. Last year, it was semi-automated by leveraging GitHub Actions, Page Speed Insights, Python, and InfluxDB. Its 2021, no more manual effort :). This year, testing is completely automated by leveraging Python with GitHub Actions, Google Page Speed Insights, and InfluxDB. In this article, we are going to deep-dive into the performance stats of various US retailers.
Table of Contents
About Black Friday Performance Testing repo
If you would like to set up the test anytime for any public website, you can do so without spending any money. The whole testing cycle leverages free tier.
Star my repo and fork it. The detailed steps have been mentioned in the repo itself. Please let me know if you face any issues.
Below are the prerequisites:
- Page Speed Insights
- Python 3.9
- GitHub Actions
- Chrome browser
- Ubuntu latest
- Influx DB Cloud (Free Plan)
Black Friday Experiment
This year’experiment started at 12.00 AM EST on Nov 25 and ended on 12.01 AM EST Nov 30.
Over 30 URLs have been included in this experiment.
Google’s Page Speed Insights API had been leveraged to measure the performance of websites.
When Page Speed Insights returns, the performance stats, it will be published to the InfluxDB cloud. InfluxDB allows 30 days of data retention under a free tier.
Performance Stats
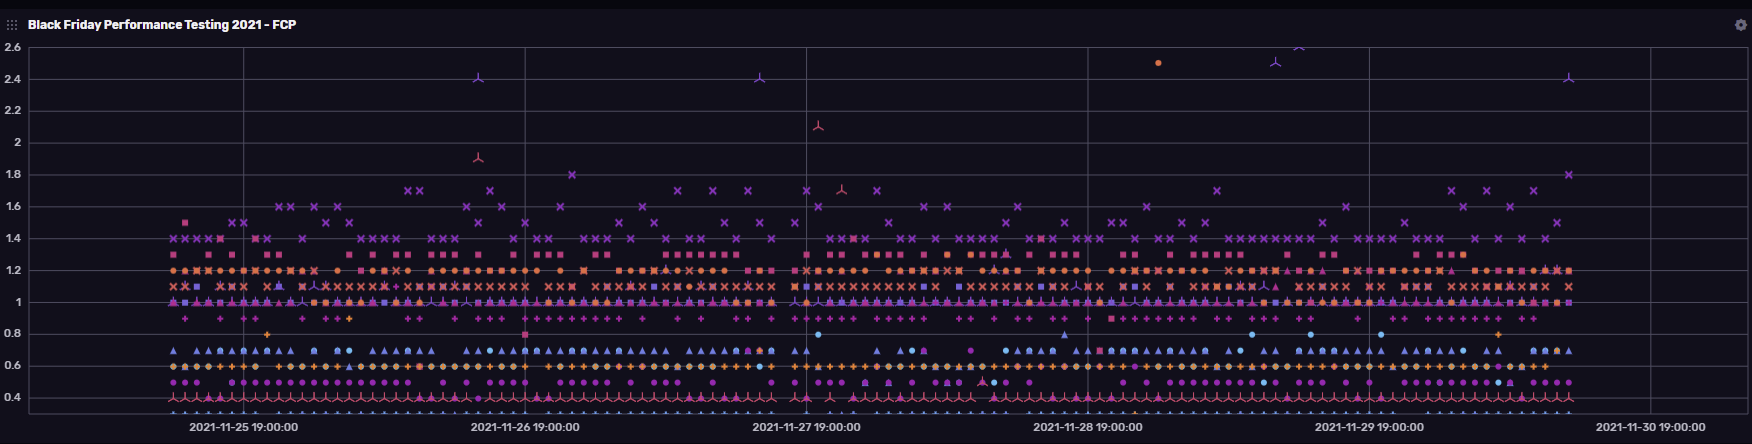
Below is the graph of First Contentful Paint against all the URLs during the holidays.
First Contentful Paint (FCP) is an important, user-centric metric for measuring perceived load speed because it marks the first point in the page load timeline where the user can see anything on the screen—a fast FCP helps reassure the user that something is happening.
The top one of the graph is from T-Mobile which clocked ~ 3 seconds. Other websites clocked under 1.5 seconds.
3 seconds for the FCP is pretty high.
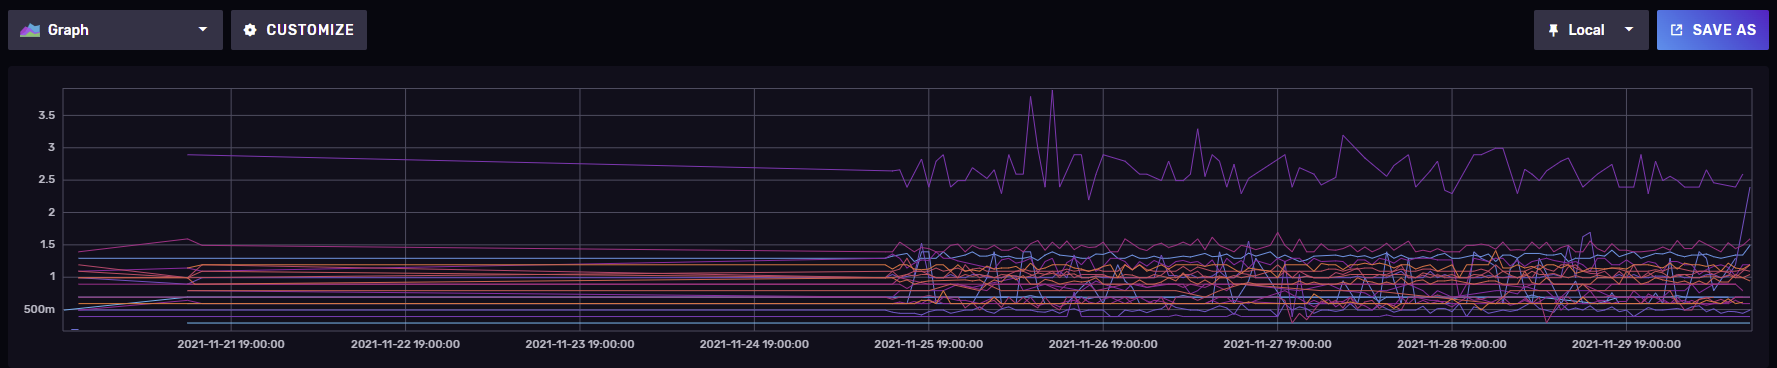
Below is the graph of First Meaningful Paint stats. Again, T-Mobile scored at the top.
First Meaningful Paint (FMP) is deprecated in Lighthouse 6.0. In practice FMP has been overly sensitive to small differences in the page load, leading to inconsistent (bimodal) results.
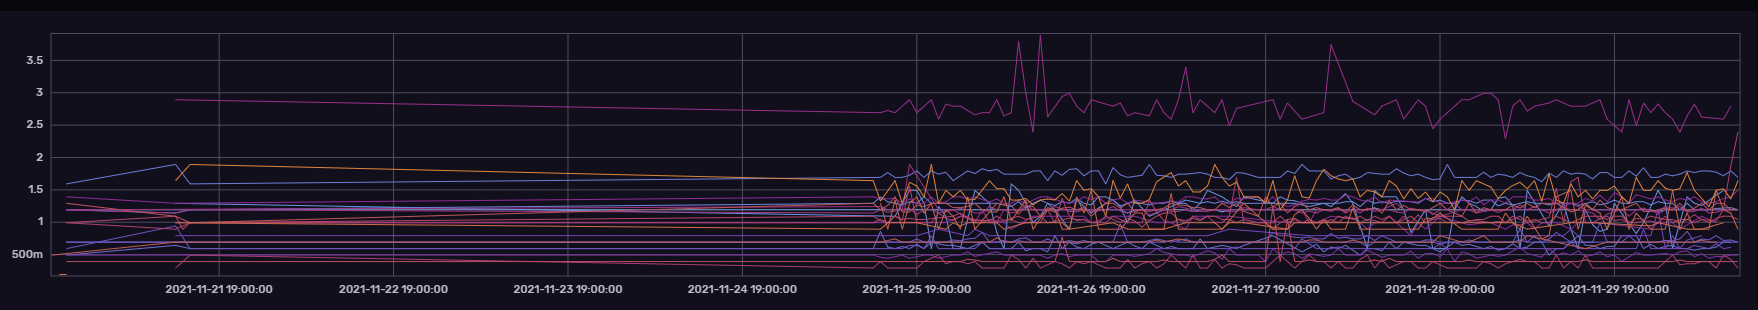
The Speed Index reveals a different pattern for petco.com. T-Mobile scores at the top in the Speed Index as well. Lower the score, better the performance.
Speed Index measures how quickly content is visually displayed during page load.
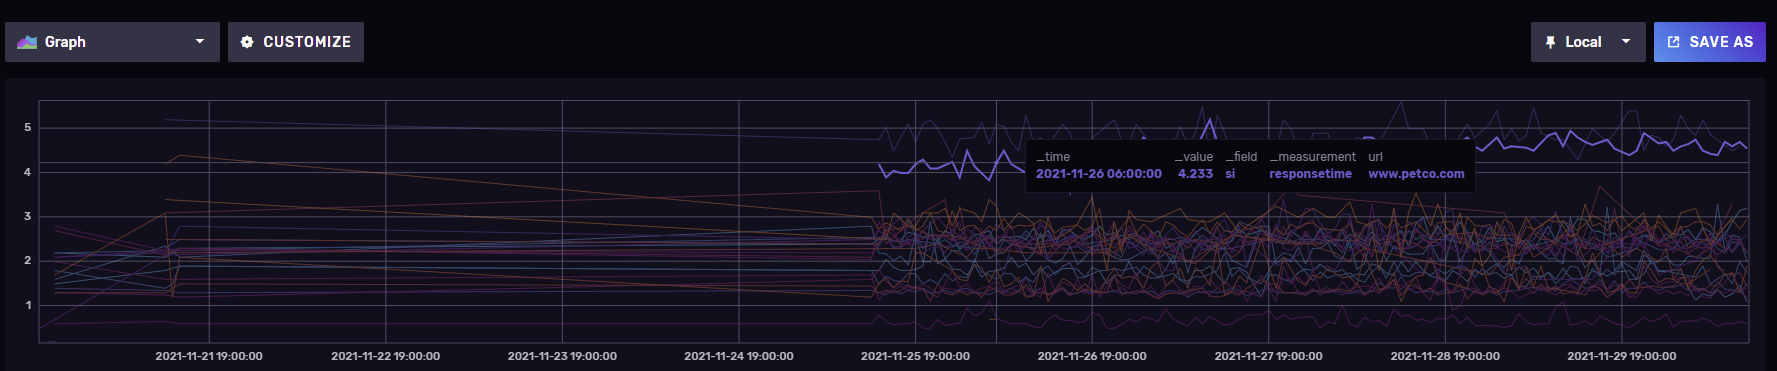
Time To Interactive is the critical metric to measure the performance.
It helps identify cases where a page looks interactive but actually isn’t. A fast TTI helps ensure that the page is usable.
Black Friday performance testing reveals that many websites have high TTI score. Below is the screenshot.
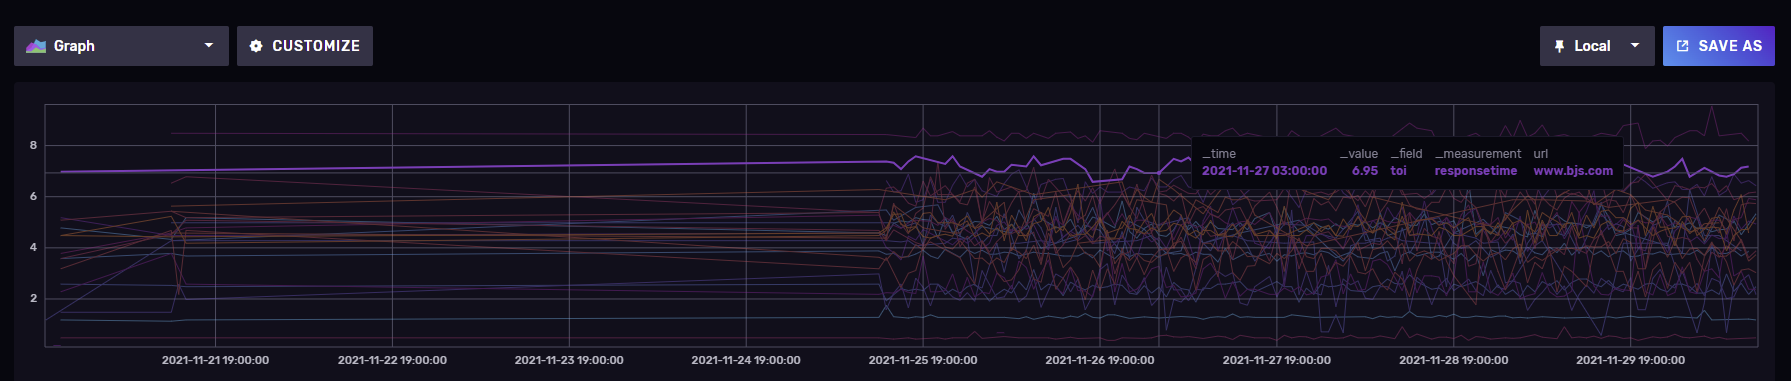
- bjs
- t-mobile
- lowes
- petco
- gamestop
- bestbuy
Below are the websites which has low TTI.
- staples
- apple
- google store
- wholefoods
- overstock
- amazon
You can check the raw data for your own analysis.
Conclusion
I have cherry-picked the URLs to test. There are a lot of URLs that were not included in this experiment. The response time of US online retailers is like a spectrum. Big giants such as Amazon, Google, Apple and others clocked faster response time. Other fortune companies still have a lot of room to improve their online store performance. See you next year to see the trend.